Statistics
Income and spending trends, broken down by category.
Summaries worked out from the data you have entered in the other modules.
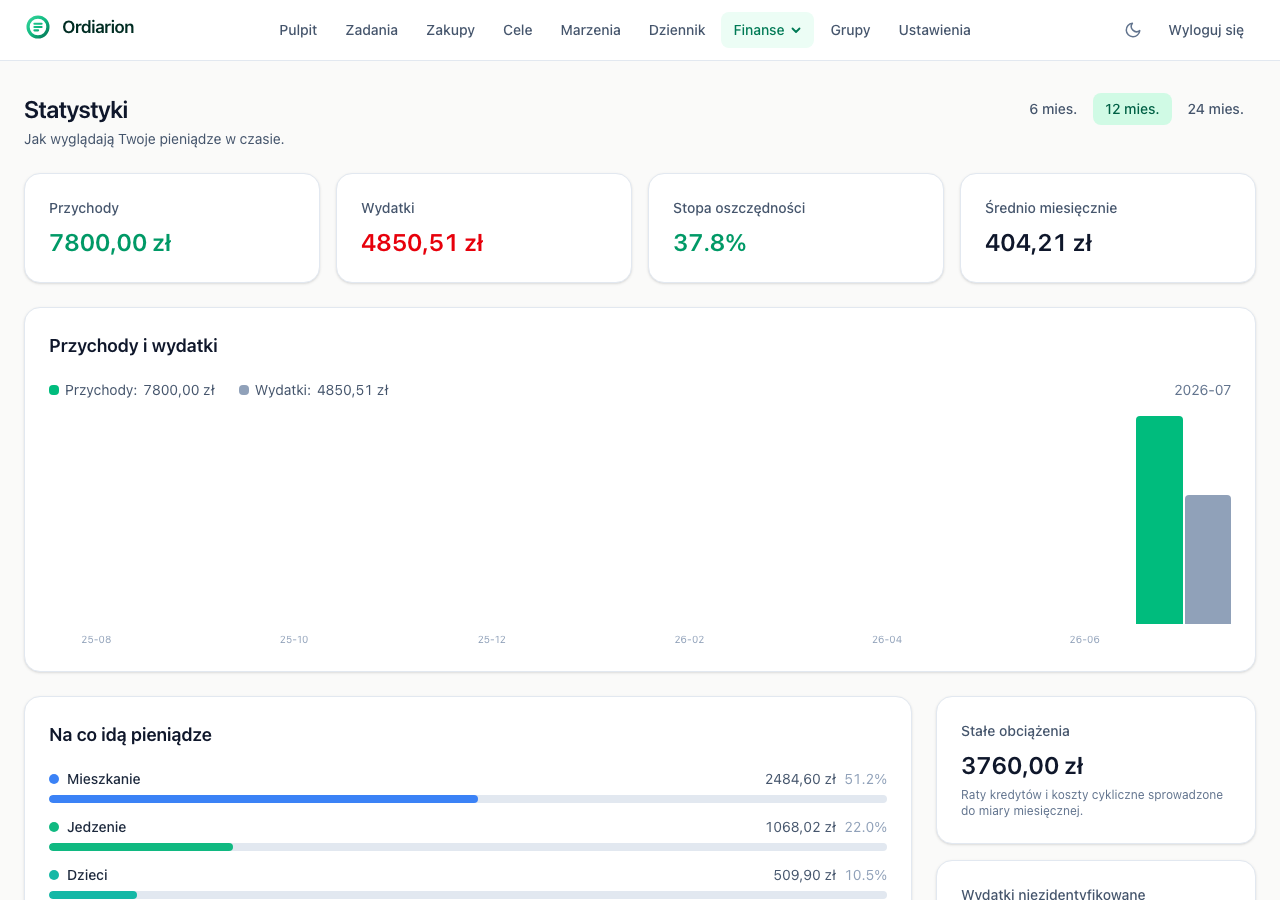
What you will see
- the trend of money in and money out, month by month,
- spending broken down by category with each one's share,
- the total of your fixed outgoings, meaning the amount leaving every month regardless of day-to-day decisions.
What it is for
The budget answers "how much is left this month". Statistics answer "is this going the right way" — a different question, and one that needs several months in view at once.
The first meaningful conclusions appear after three months of recording. Before that the chart is showing noise.